
When markets are priced for success, how much return is left for the investor?
Strong businesses can keep growing while investors earn less than they expected. At elevated valuations, the purchase price may already reflect years of rising profits. The allocation question is therefore how much future growth is needed to justify today's prices, and how heavily the portfolio depends on those expectations being met.
One response is to broaden the search for quality and value to portfolios of established private businesses. Acquired at sensible prices, sustainably profitable holdings can generate cash for shareholder distributions or further investment. A portfolio organised around selected industry verticals or activities spanning several industries allows the earnings mix to be chosen deliberately. The opportunity rests on what those businesses can earn for their owners over time, supported by disciplined acquisition and capital allocation.
Watch the briefing
Coming soon.
FULL AUDIO READING
Listen to the paper.
Audio reading coming soon.
1. Current market valuations
Valuations across markets
A market can keep rising while the reward for taking risk becomes less attractive.
The RBA, IMF and Federal Reserve point to a common concern: market prices may offer investors too little reward for the risks they are taking. In its October 2026 review, the RBA highlights the risk that AI profits fall short of expectations. The IMF also identifies higher government borrowing costs and cyber disruption as potential shocks. The Federal Reserve's May report found elevated share valuations and little extra expected return for taking equity risk. Together, these reports make the case for closer scrutiny of what current prices assume. [1, 2, 3]
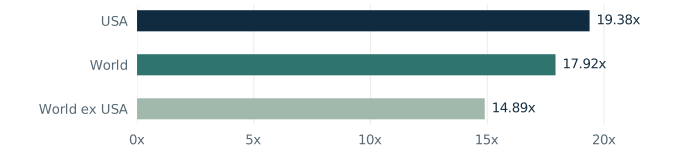
The price/earnings ratio (P/E) puts a number on what investors are paying for business earnings. At 20x, each $1 of annual earnings costs $20 to acquire. Forward P/E uses expected earnings, so a lower forward multiple may reflect earnings growth that still needs to be delivered.
Figure 1. Prices relative to earnings differ across markets
| MSCI index | P/E | Forward P/E |
|---|---|---|
| USA | 25.37x | 19.38x |
| World | 22.69x | 17.92x |
| World ex USA | 17.66x | 14.89x |
Source: MSCI index profiles, observations at 30 September 2026, accessed 30 October 2026. [4, 5, 6] Large and mid-cap indices; World covers developed markets and excludes emerging markets. World includes the USA and overlaps the other two rows. Forward figures use expected earnings. These are valuation snapshots, not subsequent returns or estimates of fair value.
Within the S&P 500 and Nasdaq-100, Stock Analysis reported trailing P/Es of 439.3x for Tesla and 157.5x for Palantir at 30 October 2026. NVIDIA was 25.9x. [25, 26]
A headline index multiple is an incomplete description of the risk an investor actually owns. A broad market holding can still depend heavily on a few demanding earnings expectations. In our view, that strengthens the case for selective allocation across businesses and markets. A private-business portfolio earns its place through sustainable earnings and a sensible acquisition price, rather than through the label attached to it.
A snapshot tells us what investors are paying. The next question is how that price compares with history.
Reading the market gauges
Market calm can coexist with valuations that leave little room for error.
Valuation gauges put market prices in the context of earnings, assets and economic output. VIX reflects the scale of S&P 500 price moves expected over the next 30 days. Reading them together helps separate what investors are paying for long-term earning power from how much near-term volatility they expect. [4, 18, 19, 20]
| Gauge | Current Level | Historical median | Plain-language meaning |
|---|---|---|---|
| Buffett-style equity/GDP comparison | About 255% for Q2 2026 | 72.2%; quarterly, Q4 1950-Q2 2026 | Equity value was about 2.55 times annual US output. This nonfinancial-business proxy includes closely held companies. [15, 16, 17] |
| Shiller CAPE | 40.58x for September 2026 | 16.61x; monthly, January 1881-September 2026 | Prices compared with ten years of inflation-adjusted earnings, reducing the effect of one unusual year. [18] |
| Trailing and forward P/E | MSCI USA: 25.37x and 19.38x at 30 September | Not available from the cited snapshot | Price per dollar of recent or expected annual earnings. The forward figure depends on forecast earnings being delivered. [4] |
| Price-to-book | MSCI USA: 5.65x at 30 September | Not available from the cited snapshot | Price compared with recorded assets minus liabilities. Internally developed know-how may not be captured. [4] |
| VIX, often called the fear gauge | 16.91 at the 28 October 2026 close | 17.56; daily closes, 2 January 1990-28 October 2026 | Expected S&P 500 volatility over about 30 days, derived from options. It does not measure whether shares are cheap. [19, 20] |
Sources and dates differ because these gauges use different inputs. Buffett's original 2001 comparison used GNP; this GDP proxy covers nonfinancial corporate equity, including closely held businesses, rather than all listed shares. [14, 15, 16, 17] The Buffett-style proxy is our calculation: US$83.050847 trillion / US$32.563030 trillion x 100, using matching Q2 observations. It is not a live October Buffett Indicator. Medians are the middle observations in each series: 300 quarterly equity/GDP ratios, 1,749 monthly CAPE readings and 9,305 daily VIX closes. CAPE uses monthly-average prices and the provider's published earnings/estimate series; incomplete October data is excluded. The cited MSCI snapshot does not supply historical medians. [4, 15, 16, 17, 18, 19, 20]
The combination matters: historically high earnings and output valuations alongside ordinary expected volatility. Our reading is that market calm offers little reassurance about the long-term return available at these prices. A portfolio can feel settled while its investment case depends on generous earnings expectations continuing to hold.
But high relative to history still leaves a question: how does today compare with earlier market extremes?
Less room for error
The question is not whether today resembles 1929 or 1999. It is how much future success investors are already paying for.
Historical valuations provide a benchmark for the expectations embedded in market prices. Comparing current levels with earlier market cycles helps assess how demanding the starting point has become, rather than identify which past episode will repeat.
September 2026 CAPE was higher than almost 99% of monthly readings since 1881, while the equity/GDP proxy was at its series high. [15, 16, 17, 18]
| Historical point | US CAPE | Fed equity/GDP proxy |
|---|---|---|
| September 1929 market boom | 32.56x | Not available |
| December 1999 / Q4 1999: dot-com extreme | 44.20x | 155.4% |
| March 2000 / Q1 2000: dot-com peak period | 43.22x | 162.6% |
| September 2007 / Q3 2007: before the GFC intensified | 26.73x | 120.6% |
| December 2008 / Q4 2008: during the GFC | 15.38x | 75.6% |
| March 2009 / Q1 2009: GFC market low period | 13.32x | 69.0% |
| December 2021 / Q4 2021: late-2021 boom | 38.30x | 218.7% |
| Current: September 2026 CAPE / Q2 2026 proxy | 40.58x | 255.0% |
Calculations from the same Shiller CAPE and Fed/BEA series used above. [15, 16, 17, 18] CAPE uses monthly-average prices. Proxy values use quarter-end equity and that quarter's annualised nominal GDP; Q1-Q4 mean the first through fourth quarters of a year. Current dates differ because the source data is published at different times. The proxy includes closely held nonfinancial equity and excludes financial companies. It is not Buffett's original public-market/GNP measure. Historical observations use the data vintage retrieved on 30 October 2026, not the vintages available to investors at each date.
At elevated valuations, the investment case becomes more demanding. Earnings growth, resilient profit margins and the multiple future investors will pay all matter. A disappointment in one can offset progress elsewhere, leaving shareholders with a weaker return despite good business performance.
Our conclusion is that these starting conditions make price discipline central to medium- and long-term allocation. Much of the business success an investor hopes to benefit from may already be reflected in the price. That is a substantive reason to broaden the search for value across listed markets and private-business portfolios, with sustainable earning power as the common reference point.
That assessment also depends on where the earnings expectations sit: are they spread across different exposures, or concentrated in the same few businesses?
2. Many holdings can depend on the same few things
A portfolio can spread capital across hundreds of securities while concentrating its earnings expectations in a handful of companies.
At 30 September 2026, the ten largest securities represented 38.19% of MSCI USA and 27.85% of MSCI World. Two Alphabet share classes are included, so ten securities do not mean ten separate companies. The number of holdings alone can overstate how widely risk is spread. [4, 5]
The useful step is to trace what drives the earnings and funding behind the holdings.
| Look at | Ask |
|---|---|
| Companies | How much of my money depends on the same big companies across funds, direct shares and superannuation? |
| Business earnings | Which holdings rely on the same customers, spending trends or profit margins? |
| Cash and borrowing | Which investments might need new loans, more money from investors or a sale at the same difficult time? |
The ECB found that flows in US technology funds held by euro area investors reacted more strongly to economic, interest-rate and risk shocks than broader share funds in its study. Shared exposures can be reinforced by investors moving together. [7]
A portfolio can contain many businesses yet depend on one economic outcome. In our view, meaningful diversification comes from differences in what drives earnings and how the businesses are funded. Several companies within a vertical can share the same demand cycle; a horizontal portfolio can carry a common technology or operating dependency across industries.
The value of an additional holding therefore lies partly in how it changes the portfolio's existing dependencies. A private technology supplier may reinforce an exposure already held through listed technology stocks. A business serving different end markets may contribute a genuinely different earnings base. Private ownership alone does not establish that distinction.
Recognising shared exposures is one part of portfolio discipline. The harder test can be maintaining that discipline when rising markets create pressure to participate.
3. Why discipline matters when confidence runs high
When rising prices make waiting feel like a mistake, what keeps capital allocation rational?
Strong market gains can create pressure to participate. As others report profits and expectations rise, the fear of missing out can make the cost of staying on the sidelines feel more immediate than the risk of overpaying. In On Bubble Watch, Howard Marks describes how that pressure can lead investors to accept prices they would otherwise question. [21]
With valuations already demanding, that is a reason to give fundamental analysis greater weight in allocation decisions. Confidence in a market theme can grow faster than the evidence supporting the price.
A disciplined approach anchors the decision to the business and the return available at the proposed price. It asks whether sustainable earnings and cash generation support the investment, how much future growth is already assumed, and whether the case still works under less favourable conditions.
Buffett's emphasis on quality and value offers a useful reference. His shareholder letters connect durable business economics and capable management with a sensible purchase price. That combination provides a basis for committing capital that does not depend on keeping pace with the latest market gains. [23, 24]
We regard discipline as most valuable when the pressure to participate is strongest. Rising prices and popular investment themes can make an increasingly demanding valuation feel easier to accept. A consistent view of quality, value and required return provides a rational basis for allocation when enthusiasm is pulling in the other direction.
That position also shapes the case for private-business portfolios. The opportunity is to own sustainable earnings at sensible prices, with capital allocated on the economics of the holdings. A fashionable sector or ambitious improvement programme has limited investment merit unless the underlying cash generation and purchase price support the return case.
Price discipline matters even when the businesses are strong. What does history tell us about the relationship between the price paid at the start and the return that follows?
4. Starting valuations and long-term returns
The cost of overpaying can be a decade of disappointing returns.
Campbell and Shiller's 2001 study found that valuation ratios helped explain later price changes better than future growth in earnings, dividends or productivity. That makes the starting price relevant even when the businesses continue to grow. [9]
Howard Marks made the relationship tangible in January 2025's On Bubble Watch. Discussing a J.P. Morgan chart of S&P 500 monthly starting observations from 1988 to late 2014, he highlighted forward P/E observations near 22x followed by approximately -2% to +2% annualised returns over ten years. He revisited the chart in The Calculus of Value, describing the starting multiple as around 23x. These are his descriptions of the same historical evidence. [21, 22]
The historical evidence makes entry-price discipline a long-term allocation issue. In our view, patience and business quality do not automatically compensate for an excessive purchase price. Strong earnings growth may still produce a modest investor return if the valuation multiple falls back.
The more compelling ownership case is one in which the price leaves room for a worthwhile return from sustainable earnings, distributions and achievable growth. That is a useful common basis for judging both listed holdings and private-business portfolios. The appeal of the business and the attractiveness of the investment remain connected by the price paid.
High starting valuations have historically been associated with weaker long-term returns. That supports selectivity on price, without needing to predict market direction. Goyal and Welch's forecasting results reinforce why a valuation argument should stand on the return case rather than precise market timing. [10, 21]
That brings us to the alternative: what would make a portfolio of private businesses worth owning on its own merits?
5. Building the private-business portfolio case
What would make a portfolio of private businesses worth holding for the next decade?
Established businesses can contribute through sustained earnings and cash distributions. The portfolio may be organised around industry verticals or horizontal activities. A vertical develops exposure within an industry or value chain; a horizontal approach connects a capability across industries.
The investment case needs four connected foundations.
1. Sensible acquisition prices. Check earnings and cash generation business by business, then after central costs, maintenance spending and borrowing. Allow for replacing working owners. The case should not require a higher sale multiple.
2. Sustainable profitability. Assess demand, costs and management continuity across the holdings. Continued profitable operations can support returns. Any expected improvements should have their costs and contribution assessed separately.
3. A deliberate mix of exposures. Look at industries, customers, geography and funding sources. A vertical can share one demand cycle; horizontal holdings can share technology or staffing pressures.
4. Capital suited to the horizon. Allow for delayed distributions, follow-on funding and time to exit. Understand where cash sits and how the participation terms connect investors to results.
A private-business portfolio can have a compelling investment case through continued profitable ownership. At a sensible purchase price, durable earnings can reward investors through distributions and reinvestment. In our view, the quality of those earnings and the discipline of capital allocation matter more than the ambition of an acquisition or improvement programme.
The choice of verticals and horizontal activities determines the sources of those earnings and the pressures they share. The portfolio's value lies in the combination: businesses worth owning individually, an earnings mix suited to the investment objective, and funding that allows the ownership case to endure. Growth and improvements can strengthen that foundation.
Who makes those acquisition and capital decisions? That is where the ownership and management approach, including AWP's role, comes into view.
AWP's role in a portfolio approach
Choosing the businesses is only part of a portfolio decision. Someone must also decide how they are owned, funded and managed.
AWP acquires businesses on its own balance sheet and remains actively involved in their management. For a capital partner considering participation, that role sits alongside the proposed portfolio's industry focus, acquisition prices and funding needs.
A portfolio approach considers each business and its contribution to the wider group. Within a vertical, examine common customers, suppliers and industry conditions. Across horizontal activities, examine shared capabilities and dependencies. Maintaining profitable operations and allocating capital carefully remain central.
Capital partners can participate in AWP's ownership activity under an agreed arrangement. The actual portfolio and structure determine the exposure and how business results reach the partner. Distinguish holdings already in place from acquisitions still proposed.
The relevant contribution of an owner-operator is the judgement linking acquisition price, business oversight and the use of cash across the portfolio. That is how individual holdings can become a coherent long-term ownership strategy. For capital partners, the economic substance lies in the actual earnings exposure and how the participation arrangement connects them to those results.
Even with a clear approach to ownership, what can still go wrong across a private-business portfolio?
6. The risks within a private-business portfolio
Several businesses can still encounter the same problem at the same time.
Verticals may share customer demand or funding conditions. Horizontal activities may share technology or labour pressures. A portfolio spreads risk only to the extent that its holdings and funding arrangements create different exposures.
Look at how a shock could travel through the portfolio.
Shared exposures and funding. Assess concentration by holding, industry and major customer. Guarantees, refinancing dates and movement of cash can connect the fortunes of otherwise separate businesses.
Liquidity and distributions. Profitable holdings may still need cash for debt payments, maintenance or investment. A portfolio interest can be difficult to sell when distributions are delayed.
Values and governance. Private valuations rely on accounts and judgement between transactions. MSCI research finds familiar size, growth and debt exposures in private-equity performance. The FCA's UK review found weaknesses in some managers' valuation checks and handling of conflicting incentives. Examine who checks values and how losses are recognised. [11, 12]
Costs and capital needs. Central overheads, acquisitions and integration can consume cash. Include business and group borrowing, management costs and any fees or profit-sharing when assessing investor returns.
The real strength of a private portfolio becomes visible when several holdings come under pressure together. Shared customers, debt guarantees or access to the same funding can transmit a problem across businesses that otherwise look separate.
Our view is that resilience comes from the underlying cash generation and the way those connections are managed. A smooth reported valuation or a large holding count offers little evidence of that resilience on its own. The portfolio's ability to sustain operations and commitments during a difficult period is the more meaningful expression of investment quality.
With those risks visible, how should a private portfolio be compared with the alternatives still available?
7. Compare the choices on the same basis
An expensive public market does not make the next private opportunity a good investment.
Investors can retain listed holdings, change their mix, hold more cash or consider a private-business portfolio. Each choice changes access to cash, exposure to earnings and the costs of participation.
| Choice | What it can offer | Main question |
|---|---|---|
| Keep a broad mix of listed shares | Investments that are usually easier to sell, with a share in future business growth. | Am I comfortable with the prices and how much depends on the largest companies? |
| Change the listed investments | Different countries, industries or businesses. | Does the new mix improve the position after costs and tax? |
| Hold more cash | Money for bills and later opportunities. | Is that flexibility worth potentially missing growth or losing buying power to inflation? |
| Invest in a private-business portfolio | Selected industry verticals or horizontal activities, with identifiable cash flows and ownership arrangements. | Do acquisition prices, exposure limits and cash returns justify the liquidity and funding risks? |
Harris, Jenkinson and Kaplan found strong historical US buyout-fund results across many earlier fund groups, with outcomes also dependent on the dataset. Those results do not establish what a specific Australian private portfolio or AWP arrangement will earn. [13]
The strongest argument for a private allocation is a better economic proposition at the price available. Public-market discomfort alone is a weak basis for committing capital. Once costs, cash-flow timing and exit constraints are included, some private opportunities will justify the commitment and others will not. A consistent comparison across the available choices is more persuasive than an asset-class preference.
A comparison becomes useful when it produces specific questions. Which questions should be answered before capital is committed?
8. Five questions before committing capital
Could you explain why this portfolio is worth owning without assuming a higher future sale price?
The answer needs to connect industry exposures with sustainable profits, cash distributions and the ownership arrangement. The same discipline applies whether the portfolio is organised around verticals, horizontal activities or a combination.
Use five questions to bring the case together.
1. What exposures are we buying? Identify the industries, shared customers and operating dependencies, including overlap with existing investments. Separate current holdings from planned acquisitions.
2. What does the portfolio earn and distribute? Review holding-level cash generation and the combined result after reinvestment, central costs and debt payments. Establish how cash reaches the investor.
3. Can the profits continue? Assess demand, costs and management continuity. Test weaker trading across several businesses. Evaluate improvements separately from continued profitability.
4. How is capital managed? Examine acquisition decisions, borrowing, guarantees, refinancing and potential requests for more money. Test delayed distributions and an exit at lower valuations.
5. Does the mix suit the investor? Compare expected cash returns, costs, liquidity and potential losses with other choices and existing commitments.
Our conclusion is that elevated listed-market valuations justify a broader, more selective search for long-term business earnings. Private portfolios are a credible part of that search when their prices, sustainable profitability and industry exposures support the ownership case. The opportunity is to allocate on the strength of the businesses and the cash they can generate, with the patience and capital structure to remain invested.
Together, these questions bring the analysis back to the central allocation decision: where durable earning power is available at a price that justifies committing capital.
9. Conclusion: a wider search for durable earnings
The evidence in this paper points to demanding starting valuations and concentrated earnings expectations in parts of the listed market. Historical context gives those conditions perspective. It helps explain why a business can remain successful while the return available at its share price becomes less compelling.
Private-business portfolios offer another avenue for allocating capital to established earning power. Selected industry verticals or horizontal activities can bring together profitable businesses with identifiable customers, cash flows and operating economics.
The attraction is the ability to build an ownership case around what those businesses can earn over time. Continued profitability can support distributions and reinvestment, with growth and operational improvements adding to the opportunity. Acquisition prices, the mix of exposures and the funding arrangements determine how much of that earning power can benefit shareholders.
Our position is that current conditions justify a broader, more selective approach to medium- and long-term allocation. Durable business quality, a sensible purchase price and disciplined use of capital provide a coherent basis for that approach across listed and private markets.
A well-constructed private-business portfolio deserves consideration on those terms. Its case rests on the earning power being acquired, the resilience of the portfolio and the return that remains for its owners after the costs of ownership.
Glossary and research basis
P/E: Share price divided by annual profit per share. Forward P/E uses expected profit.
Risk premium: The extra return investors expect for accepting more risk than a specified low-risk alternative. It is estimated, not a guaranteed payment.
Liquidity: How easily an investment can be turned into cash. An illiquid investment may take a long time to sell or require a lower price.
Leverage: Using debt to help fund an investment. It can increase percentage gains and losses on the owners' money.
Appraisal smoothing: Estimated values changing more slowly than the business's economic value. This can make reported results look steadier and less connected with other markets than they really are.
IRR: An annualised return calculated from the amounts and dates of money invested and received. Read it alongside cash paid back and the estimated value remaining.
Private-business portfolio exposure: An economic interest in a collection of unlisted businesses through ownership or another agreed arrangement. The actual holdings and participation terms determine the exposure and rights.
Industry vertical: Businesses within an industry or its value chain.
Horizontal activity: A service or capability used across several industries. A portfolio organised around it may retain shared operating risks.
Research basis
Research was checked on 30 October 2026, Australia/Brisbane. MSCI ratios are at 30 September, CAPE is the September reading, the Buffett-style proxy uses Q2, and VIX is the 28 October close. Historical figures include source revisions downloaded on the research date. Company P/E examples use the 30 October close, with 29 October fund holdings used to check inclusion; these additions were checked on 1 November 2026.
Institutional, commercial and academic sources support the market discussion. The examples explain arithmetic, not return forecasts. The ownership framework is our interpretation. We claim neither a general private-business discount nor AWP past returns.
MSCI sells data and index products. The historical US fund results and UK regulatory findings concern their stated markets and settings, rather than a specific Australian private-business portfolio.
References
-
Reserve Bank of Australia (1 October 2026). Financial Stability Review: Financial Stability Assessment. Overall assessment and discussion of low risk premia, AI exposures, resilience and transmission to Australia. Read source.
-
International Monetary Fund (October 2026). Global Financial Stability Report: Resilience, Risk, and Transformation. Report overview and risk framework; released 13 October. Read source.
-
Board of Governors of the Federal Reserve System (May 2026). Financial Stability Report: Overview. Market conditions and data through 23 April 2026. Read source.
-
MSCI (30 September 2026 observations). MSCI USA Index, index 984000. Profile ratios and top ten constituent weights. Read source.
-
MSCI (30 September 2026 observations). MSCI World Index, index 990100. Developed-market profile ratios and top ten constituent weights. Read source.
-
MSCI (30 September 2026 observations). MSCI World ex USA Index, index 991000. Developed markets excluding the United States; profile ratios. Read source.
-
Baudino, P. A., Bosio, F., Dieckelmann, D., Kaufmann, C. and Puga, M. L. (May 2026). Drivers of investor behaviour in highly valued equity markets. ECB Financial Stability Review. Valuation chart through 19 May; flow-model discussion and limits. Read source.
-
Reserve Bank of Australia (1 October 2026). Financial Stability Review: 1. The Global Macro-financial Environment. Summary and analysis of risk premia, AI financing and private-credit vulnerabilities. Read source.
-
Campbell, J. Y. and Shiller, R. J. (April 2001). Valuation Ratios and the Long-Run Stock Market Outlook: An Update. NBER Working Paper 8221. US data 1871-2000 and twelve-country quarterly evidence since 1970. Read source.
-
Goyal, A. and Welch, I. (19 September 2005 draft). A Comprehensive Look at the Empirical Performance of Equity Premium Prediction. The linked draft is the version consulted; later published in Review of Financial Studies (2008), 21(4), 1455-1508. Read consulted draft.
-
Shepard, P. and Baker, W. (16 July 2025). Tracking Private Equity: Understanding the fundamental drivers of private equity performance. MSCI. Commercial-provider research; factor exposures and interpretation of private-equity performance. Read source.
-
Financial Conduct Authority (5 March 2025). Private market valuation practices. Multi-firm review, especially sections 1.4, 2.2-2.4; UK firms and regulatory context. Read source.
-
Harris, R. S., Jenkinson, T. and Kaplan, S. N. (February 2012). Private Equity Performance: What Do We Know? NBER Working Paper 17874; later published in Journal of Finance (2014), 69(5), 1851-1882. Historical US buyout and venture fund evidence. Read source.
-
Buffett, W., with Loomis, C. (10 December 2001). Warren Buffett on the stock market. Fortune, reproduced by Berkshire Hathaway; PDF page 6. Original equity-market-value/GNP discussion. Read source.
-
Board of Governors of the Federal Reserve System (11 September 2026 update). Nonfinancial Corporate Business; Corporate Equities; Liability, Level, NCBEILQ027S, via FRED. Q2 2026: US$83,050,847 million. Read source.
-
US Bureau of Economic Analysis (29 October 2026 vintage), via FRED. Gross Domestic Product, GDP. Matching Q2 2026 observation: US$32,563.030 billion, seasonally adjusted annual rate. Q3 GDP is not mixed with Q2 equity values. Read source.
-
Board of Governors of the Federal Reserve System. Financial Accounts Guide: FL103164105. Series composition includes public and closely held nonfinancial corporate equities. Accessed 30 October 2026. Read source.
-
Shiller, R. J. US Stock Markets 1871-Present and CAPE Ratio, Data worksheet, column M. Download checked 30 October 2026. September 2026 CAPE: cell M1877, 40.580874; historical mean calculated from January 1881-September 2026. Original monthly data and methodology; historical comparisons use this same downloaded vintage, not point-in-time historical releases. Data and source notes.
-
Cboe. VIX FAQ. Options-based, constant-maturity 30-day expected S&P 500 volatility; methodology accessed 30 October 2026. Read source.
-
Cboe, via FRED (29 October 2026 update). CBOE Volatility Index: VIX, VIXCLS. Daily closing observations: 9 October 2007, 16.12; 20 November 2008, 80.86; 16 March 2020, 82.69; latest available when checked, 28 October 2026, 16.91. Read source.
-
Marks, H. (January 2025). On Bubble Watch. Oaktree Capital Management. J.P. Morgan chart discussion of starting forward P/E and subsequent ten-year S&P 500 returns. Memo dated 2 January; web page dated 7 January. Read source.
-
Marks, H. (14 August 2025). The Calculus of Value. Oaktree Capital Management. Revisits the starting-valuation example and distinguishes long-term valuation effects from short-term price movements. Read source.
-
Buffett, W. 1989 Letter to Shareholders. Berkshire Hathaway. Business quality, management and purchase price; section on lessons from the first twenty-five years. Read source.
-
Buffett, W. 2007 Letter to Shareholders. Berkshire Hathaway. Business economics, competitive advantage, management and price; printed pages 6-7. Read source.
-
Stock Analysis (30 October 2026 close; checked 1 November). Company statistics, provider-reported trailing P/E: Tesla, Palantir, NVIDIA.
-
Stock Analysis/Finnhub (29 October 2026 holdings; checked 1 November). Index-tracking fund holdings: SPY, S&P 500, QQQ, Nasdaq-100.
AWP discussion paper · awp-public-market-valuations · Version 44